
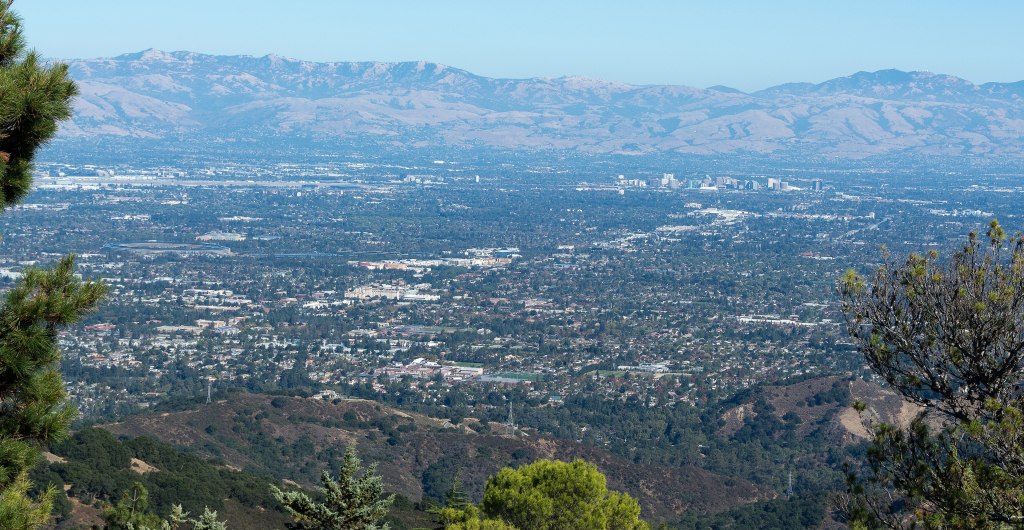
Top image: San Jose and the Silicon Valley floor seen from the foothills, October 2017. Photo: Tom Pavel from San Jose, USA / CC BY 2.0 via Wikimedia Commons
San Jose households pay more for their monthly bills than households in any other large American city, according to a new report from doxoINSIGHTS, the research arm of bill payment company doxo. The median San Jose household spends $44,947 a year on 13 common bills, including rent or mortgage, utilities, insurance and car payments, 78% above the national median of $25,266, San José Spotlight reported.
The ranking puts San Jose ahead of New York ($40,794), San Francisco ($39,696), San Diego ($39,345) and Boston ($38,630). San Jose also ranks first when housing is excluded, with a median of $16,329 a year in non-housing bills, according to the report.
The column most headlines skipped
The same table includes a second measure that complicates the story. Doxo’s “income-adjusted” Cost of Bills Index compares bill costs with local median income, where 100 equals the national norm. By that measure San Jose scores 104, meaning its bills take only slightly more of a typical household’s income than the national baseline.
A Chronicle review of the report’s 50-city table found that 40 cities score higher than San Jose on that income-adjusted index, including Los Angeles (150), Miami (146), Boston (122), San Diego (120) and New York (117). Only seven score lower, among them San Francisco (92), Pittsburgh (90) and Seattle (102). The report puts San Jose’s bills at 31% of median income, compared with 45% in Los Angeles and 51% in Detroit.
That does not mean San Jose is affordable. It means the median San Jose household earns enough to absorb the country’s highest bills, and medians hide the people below them.
Who the median leaves out
That is the gap residents described to San José Spotlight. “(Politicians are) missing the whole community that does not make six figures,” said Amber Long, a lifelong resident and mother of three. Michael O’Connell, 72, who has lived in San Jose since 1960, said he can cover his expenses in retirement only because of a low mortgage after he sold his previous home and bought a condo. “I don’t see how people do it nowadays,” he said.
Alison Cingolani, director of policy at the affordable housing group SV@Home, told the outlet that lower-end wages have not kept pace with broader income growth, leaving some renters spending more than half their income on housing. “Housing costs kind of feed into even the things that it’s not obvious that housing costs feed into,” she said.
Some of the steepest costs are not housing at all. Auto insurance bills in San Jose run 208% above the national median, water and sewer 121% higher and waste and recycling 115% higher, according to the report as cited by San José Spotlight.
The regional mood matches the data
The findings echo the Joint Venture Silicon Valley 2026 poll the Chronicle examined this week. As San José Spotlight noted, 48% of residents in that poll said they could not consistently cover monthly expenses while also saving or investing, 59% had cut back on groceries or other necessities in the past five years, and 47% had taken on debt or relied on credit cards to cover expenses.
Russell Hancock, president and CEO of Joint Venture, pointed to resistance to new development as a factor compounding the region’s housing shortage, San José Spotlight reported.
A note on the method
Doxo says its data comes from aggregated, anonymized bill payments by more than 10 million consumers to more than 120,000 billers, covering 97% of U.S. ZIP codes. That makes it a measure of what people actually pay, not what services are listed at. It is also a measure of medians: it cannot show how bills are distributed within a city, which is where San Jose’s affordability problem is concentrated.
The long view
San Jose’s top ranking is a product of its success: high incomes bid up housing, and housing costs ripple into insurance, services and wages. The income-adjusted figure is a reminder that the Valley’s affordability crisis is less about an average household going broke than about a widening gap between the households that set prices and the ones that must meet them. For City Hall, that argues for measuring policy against the bottom half of the income distribution, not the median, whether the subject is housing production, utility rates or the cost of keeping a car on the road. Cities that ignore the distribution risk losing the teachers, care workers and service workers whose bills are not captured by the median.
Sources
- doxoINSIGHTS, Top 50 U.S. Cities Household Bill Pay Report 2026
- San José Spotlight, “San Jose ranks No. 1 for U.S. cities with highest household bills,” Oct. 21, 2026
- South Bay Chronicle, “The Valley’s Mood Before the Vote”, Oct. 19, 2026


Leave a Reply